In today’s fast-paced software development world, quality assurance (QA) is more than just finding bugs. It’s about showing how QA adds value. To do this, teams must track the right QA metrics—the ones that truly reflect the impact of testing on product quality, team performance, and business goals.
This blog explains which QA metrics matter, why they’re important, and how to use them to prove your value.
Why QA Metrics Are Important
QA metrics help you:
-
Measure progress and test effectiveness
-
Identify bottlenecks in the process
-
Show the value of QA to stakeholders
-
Improve quality and reduce risk over time
But remember: collecting too many metrics can be confusing. Focus only on the ones that drive decisions and improvements.
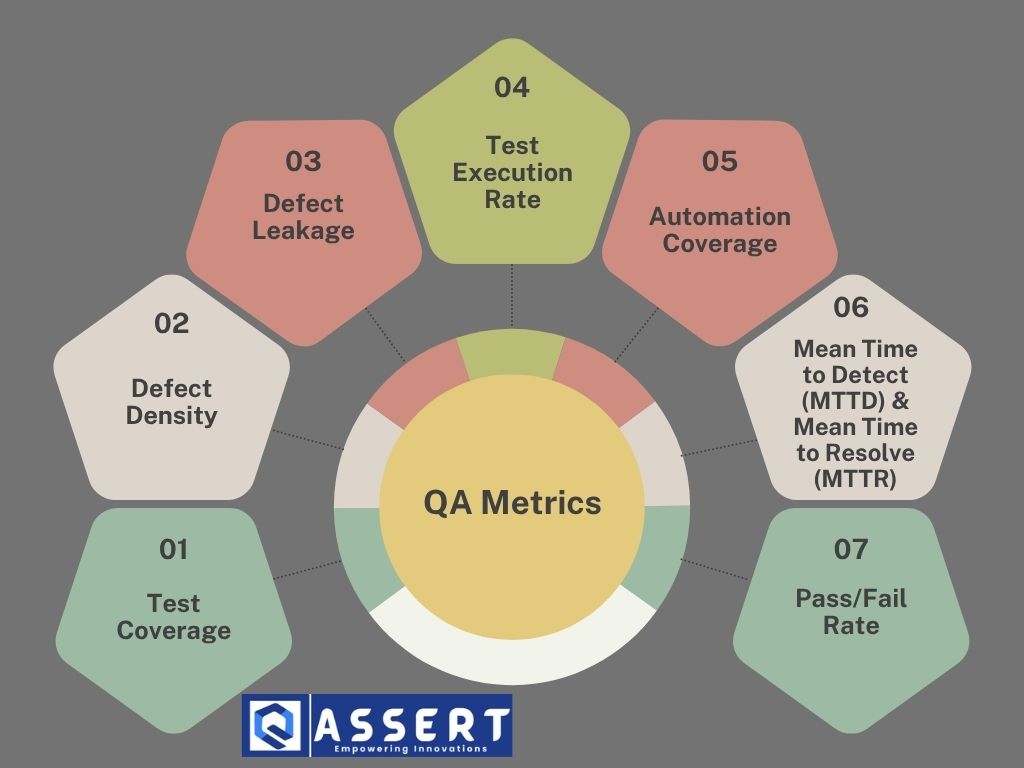
Top QA Metrics That Matter
1. Test Coverage
This shows how much of the application your tests are covering.
-
Why it matters: Helps find untested areas in the application
-
Example: % of code lines, functions, or features covered by tests
-
Tip: Use tools like JaCoCo or SonarQube to measure this metric in real-time.
2. Defect Density
This shows the number of defects found per size of software (e.g., per 1,000 lines of code).
-
Why it matters: Helps measure code quality
-
Action: High defect density? Focus on code reviews and refactoring
3. Defect Leakage
This measures how many bugs escaped to production after testing.
-
Why it matters: Helps assess test effectiveness
-
Low leakage = good testing, high leakage = need for better test cases
4. Test Execution Rate
This shows how fast and consistently tests are being executed.
-
Why it matters: Monitors team productivity and test performance
-
Tools like Jenkins or GitHub Actions can help track and automate your test runs.
5. Automation Coverage
This is the percentage of test cases automated out of total test cases.
-
Why it matters: Shows how scalable and efficient your testing is
-
Focus on automating high-risk, frequently-used test cases
6. Mean Time to Detect (MTTD) & Mean Time to Resolve (MTTR)
-
MTTD: Time taken to detect a defect
-
MTTR: Time taken to fix a defect
-
Why it matters: Shorter times = faster feedback and stronger team response
7. Pass/Fail Rate
This shows the number of test cases passed vs. failed in a test cycle.
-
Why it matters: Provides a quick health check of your build
-
Useful for sprint reviews and release readiness
How to Demonstrate QA Impact
Use dashboards, reports, and tools to visualize your metrics. Share these regularly with stakeholders to:
-
Show trends (improvements over time)
-
Back decisions with data (like when to release)
-
Justify QA investments (like new tools or training)
Check out Allure Reports or ExtentReports to visualize test results effectively.
Pro Tips for Using Metrics Effectively
-
Don’t chase numbers. Focus on outcomes and improvements.
-
Context matters. One metric alone doesn’t tell the whole story.
-
Customize your metrics based on your team’s goals and processes.
-
Automate metric tracking where possible to save time and improve accuracy.
Conclusion
QA metrics that matter aren’t just numbers—they tell a story about quality, speed, and value. When you track the right ones, you not only improve your testing but also demonstrate the true impact of QA to your team and organization.